
Find and fix SQL Server blocking in DataGrip
Updated
Your application hangs, a report never finishes, and a simple UPDATE has been "running" for two minutes. Most of the time SQL Server is not slow at all: one session holds locks that others wait for. This guide shows how to find that session from DataGrip, how to decide what to do with it, and how to stop it from happening again.
Blocking is not a deadlock
- Blocking: session B waits for a lock that session A holds. It lasts until A commits, rolls back or is killed. SQL Server does not resolve it on its own.
- Deadlock: A waits for B and B waits for A. SQL Server notices within seconds, picks a victim, rolls back its transaction and returns error 1205 to it.
Blocking chains can be long: A blocks B, B blocks C and D. The session to look at is the head blocker, the one that blocks others and waits for nobody.
Step 1: see the chains
With QueryScope: open the QueryScope tool window, choose the Blocking tab, pick your SQL Server data source and click Start. The tree shows head blockers at the top and the sessions they block under them, refreshed every 5 seconds.
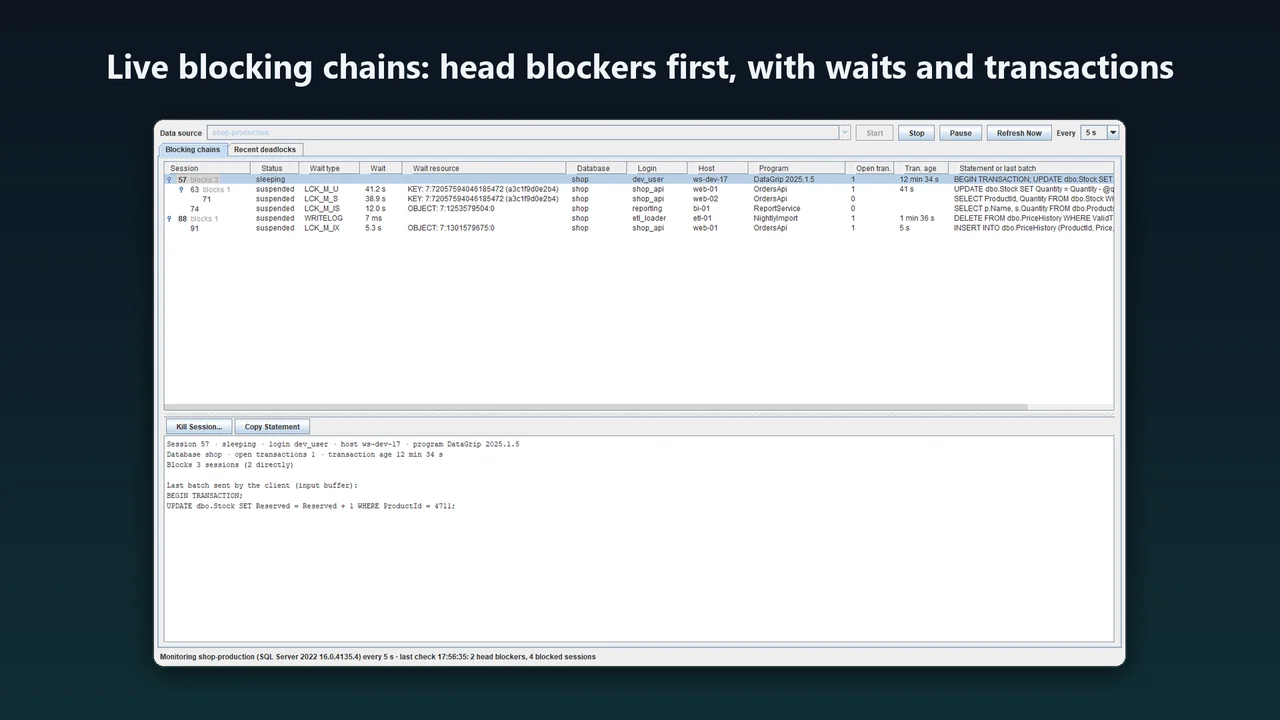
Without QueryScope, this query in a DataGrip console lists the blocked requests and their blockers:
SELECT r.session_id, r.blocking_session_id, r.wait_type, r.wait_time, r.wait_resource,
       s.login_name, s.host_name, s.program_name, t.text AS sql_text
FROM sys.dm_exec_requests AS r
JOIN sys.dm_exec_sessions AS s ON s.session_id = r.session_id
OUTER APPLY sys.dm_exec_sql_text(r.sql_handle) AS t
WHERE r.blocking_session_id <> 0;
It shows one level at a time; you follow blocking_session_id by hand to find the head, and an idle head blocker has no request row, so its statement is not in this result. sys.dm_exec_input_buffer(session_id, NULL) shows the last batch it sent.
Either way, the login needs VIEW SERVER STATE (on SQL Server 2022 and later, VIEW SERVER PERFORMANCE STATE is enough). Without it SQL Server quietly shows only your own sessions, which looks like "no blocking". QueryScope checks the permission first and shows the GRANT statement to ask your DBA for.
Step 2: read the head blocker
Look at three things:
- Status and open transactions.
sleepingwith one or more open transactions means the session finished its last statement but never committed. Typical causes: a console with manual commit mode, a script that stopped halfway, an application that opened a transaction and waits for user input. - Transaction age. Minutes or hours are a red flag. Everything it changed stays locked for that long.
- Last batch (input buffer). It tells you which code opened the transaction. In QueryScope it is in the details pane under the tree.
A head blocker that is running or suspended is different: it is doing work (a large UPDATE, an index rebuild, a cleanup job). Its wait type (for example WRITELOG or PAGEIOLATCH_SH) tells you what it waits for itself.
Step 3: decide what to do
- Ask first. If the head blocker is a person's console or a job you know, committing or rolling back at the source is the cleanest fix.
- Kill it when you must.
KILL <session id>ends the session and rolls back its open transaction: every change in that transaction is lost, and the rollback can take as long as the work it undoes. The locks stay until the rollback ends. In QueryScope, select the head blocker and click Kill Session...; the confirmation names the login, host, program, transaction age and the number of sessions it blocks. KILL needs ALTER ANY CONNECTION (sysadmin and processadmin have it). - Do not kill the victims. Killing a blocked session does not help the others; the head blocker keeps its locks.
Step 4: fix the cause
- Keep transactions short. Commit as soon as the work is done; never wait for user input inside a transaction. In DataGrip, check whether your console runs in manual commit mode.
- Index the predicates of UPDATE and DELETE. Without an index SQL Server scans and locks far more rows than it changes, and long scans hold locks longer.
- Let readers stop waiting for writers.
READ_COMMITTED_SNAPSHOT(or snapshot isolation) lets SELECT statements read the last committed version instead of waiting. Test it first: it uses tempdb and changes behaviour for code that relies on blocking. - Split big changes into batches. Deleting millions of rows in one statement holds locks for its whole duration and can escalate to a table lock.
- Set a lock timeout in applications that should fail fast rather than wait (
SET LOCK_TIMEOUT, or the command timeout of the driver).
Deadlocks: what SQL Server already recorded
SQL Server writes every deadlock to the built-in system_health Extended Events session. In QueryScope, open Recent deadlocks: each entry shows the time, the victim, the processes, the locked objects and the statements. Copy XML copies the deadlock graph; Save .xdl writes a file that SQL Server Management Studio opens as a picture. Common fixes are to access tables in the same order in every transaction, to add the index the statements need, and to keep the transactions short.
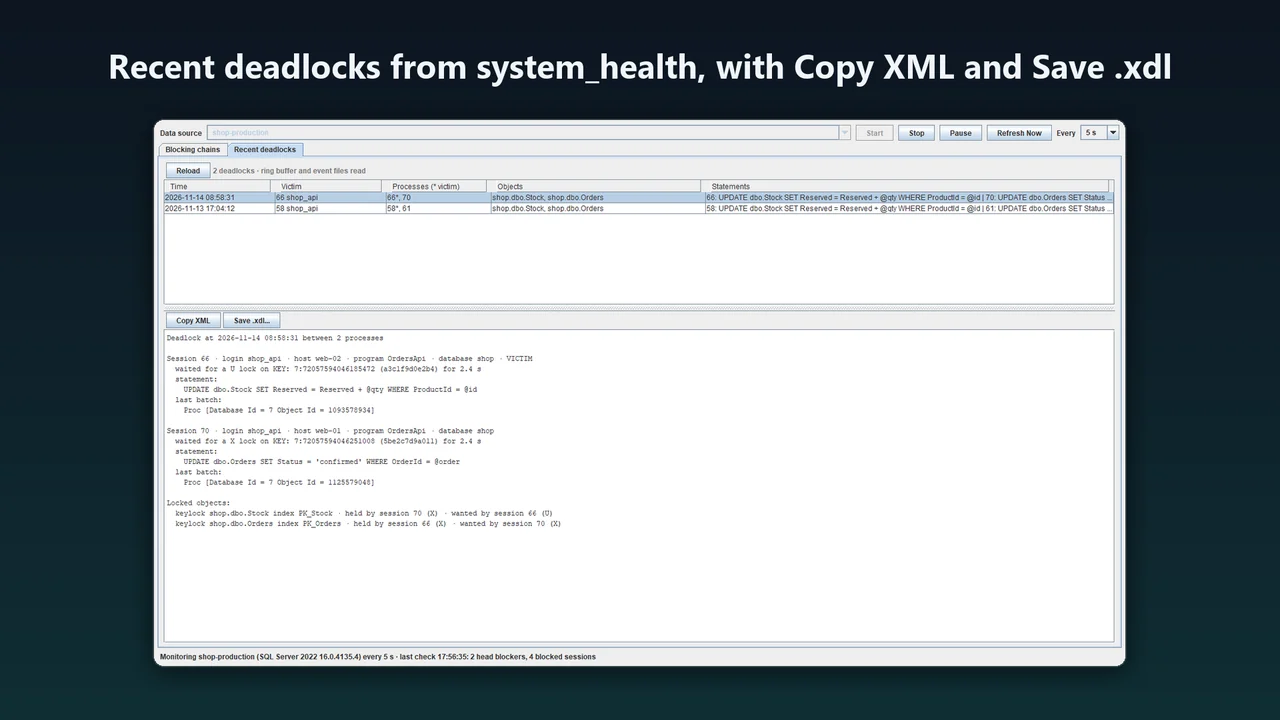
The ring buffer of system_health keeps only recent events; its event files keep more and are read too when the login may read them. A deadlock can take up to about two minutes to appear, because system_health hands its events to its targets in batches.
Get QueryScope
The blocking monitor is part of QueryScope, next to its Extended Events capture (see how to profile SQL Server queries in a JetBrains IDE), its Query Store view and its execution plan viewer. It works in DataGrip, IntelliJ IDEA Ultimate and other IDEs with Database Tools, builds 251 to 263. QueryScope costs $39 a year for individuals and $79 for organizations, with a 30-day trial: QueryScope on JetBrains Marketplace.
FAQ
What is the difference between blocking and a deadlock?
Blocking lasts until the session that holds the lock commits, rolls back or is killed; SQL Server does not resolve it on its own. In a deadlock two sessions wait for each other, and SQL Server picks a victim within seconds, rolls back its transaction and returns error 1205 to it.
Does QueryScope change my database?
No. Every statement of the Blocking view only reads, except the KILL that you confirm.
Does it store my password?
No. It uses the data source and connection of the IDE.
Which servers does the Blocking view support?
SQL Server 2016 SP1 and later (it needs sys.dm_exec_input_buffer). It is tested on SQL Server 2019, 2022 and 2025. Azure SQL Database and Azure Synapse Analytics are not supported by the Blocking view.
What does the blocking monitor cost?
It is part of QueryScope: $39 a year for individuals and $79 for organizations, with a 30-day trial on JetBrains Marketplace.
More guides
How to profile SQL Server queries in DataGrip, Rider or IntelliJ with Extended Events
Extended Events replaces SQL Server Profiler. Create a session for rpc_completed and sql_batch_completed, read the ring buffer, and drop the session when you are done, or let QueryScope do it inside your JetBrains IDE.
Read the guide →SQL Server Query Store in DataGrip
A query that was fast yesterday is slow today, and nothing in the code changed: very often it got a different plan. How to check that Query Store is on, find the top resource consumers and regressed queries, read the plans and force the good one from DataGrip.
Read the guide →Copy many tables between SQL Server databases in DataGrip
A handful of tables is a chore; forty tables with foreign keys, identity columns and rows that already exist on the other side is where it goes wrong. The questions to answer first, the manual T-SQL way, DataGrip's own data transfer and a sync script you review first.
Read the guide →