
SQL Server Query Store in DataGrip
Updated
A query that ran in a few milliseconds yesterday now takes seconds, and nothing in the code changed. Very often the query got a different execution plan. SQL Server's Query Store records exactly this: every query, every plan it ran with, and how each plan performed over time. This guide shows how to use it from DataGrip, including on macOS and Linux where SQL Server Management Studio does not run.
What Query Store keeps
Query Store (SQL Server 2016 and later) lives inside each database. It keeps:
- the text of each query (
sys.query_store_query_text) and the query itself (sys.query_store_query, with the procedure or function it belongs to), - every plan the query was compiled to (
sys.query_store_plan, with the plan XML), - runtime statistics per plan and per time interval (
sys.query_store_runtime_statsandsys.query_store_runtime_stats_interval): executions, CPU time, duration, logical and physical reads, memory grant and more, as averages, minimums and maximums.
Because it is stored in the database, it survives restarts and fail-overs, and it is there when you look at a problem the next morning.
Step 1: check that Query Store is on
Run this in a DataGrip console in the database you care about:
SELECT actual_state_desc, desired_state_desc, readonly_reason,
       current_storage_size_mb, max_storage_size_mb, interval_length_minutes, query_capture_mode_desc
FROM sys.database_query_store_options;READ_WRITE: Query Store records.READ_ONLYwhile the desired state isREAD_WRITE: it stopped recording.readonly_reasonsays why; 65536 means it reachedMAX_STORAGE_SIZE_MB. Raise the limit or let size-based cleanup remove old data.OFF: turn it on (it needs ALTER on the database):
ALTER DATABASE [YourDatabase] SET QUERY_STORE = ON (OPERATION_MODE = READ_WRITE);New databases on SQL Server 2022 and later have Query Store on by default. On older versions you turn it on per database.
In QueryScope, open the QueryScope tool window, choose the Query Store tab, pick your SQL Server data source, click Connect and choose the database. The line above the tabs shows the state, size and interval; if Query Store is off or read-only, QueryScope says so and shows the statement above.
Step 2: the permissions you need
- Reading Query Store needs VIEW DATABASE STATE in the database. From SQL Server 2022, VIEW DATABASE PERFORMANCE STATE is enough. Without it, SQL Server refuses the Query Store views with a "permission denied" error, while
sys.database_query_store_optionsstill answers, so a script can look as if Query Store were simply empty. - Forcing and unforcing a plan needs ALTER on the database. Without it,
sp_query_store_force_planfails with a permission error.
USE [YourDatabase];
GRANT VIEW DATABASE STATE TO [your_user];
QueryScope checks both before it shows anything. Without the first it shows the GRANT statement for your DBA; without the second it reads normally and explains why Force Plan is not offered.
Step 3: find the top resource consumers
Query Store keeps an average per plan and interval, so a correct total is the average times the number of executions, summed. Averaging the averages gives wrong answers as soon as one interval ran ten times more often than another.
DECLARE @from datetimeoffset = DATEADD(HOUR, -24, SYSDATETIMEOFFSET());
SELECT TOP (25) p.query_id,
       SUM(rs.count_executions) AS executions,
       SUM(rs.avg_cpu_time * rs.count_executions) / 1000.0 AS cpu_total_ms,
       SUM(rs.avg_duration * rs.count_executions) / 1000.0 AS duration_total_ms,
       SUM(rs.avg_logical_io_reads * rs.count_executions) AS logical_reads_total
FROM sys.query_store_runtime_stats AS rs
JOIN sys.query_store_runtime_stats_interval AS rsi ON rsi.runtime_stats_interval_id = rs.runtime_stats_interval_id
JOIN sys.query_store_plan AS p ON p.plan_id = rs.plan_id
WHERE rsi.end_time > @from
GROUP BY p.query_id
ORDER BY cpu_total_ms DESC;
CPU time and duration are stored in microseconds; logical reads are 8 KB pages; memory grants are 8 KB pages too.
In QueryScope, the Top resource consumers tab does this for the last hour, 24 hours, 7 days or a custom window, by total or average CPU time, duration, logical reads, memory grant or executions, with the query text and object name.
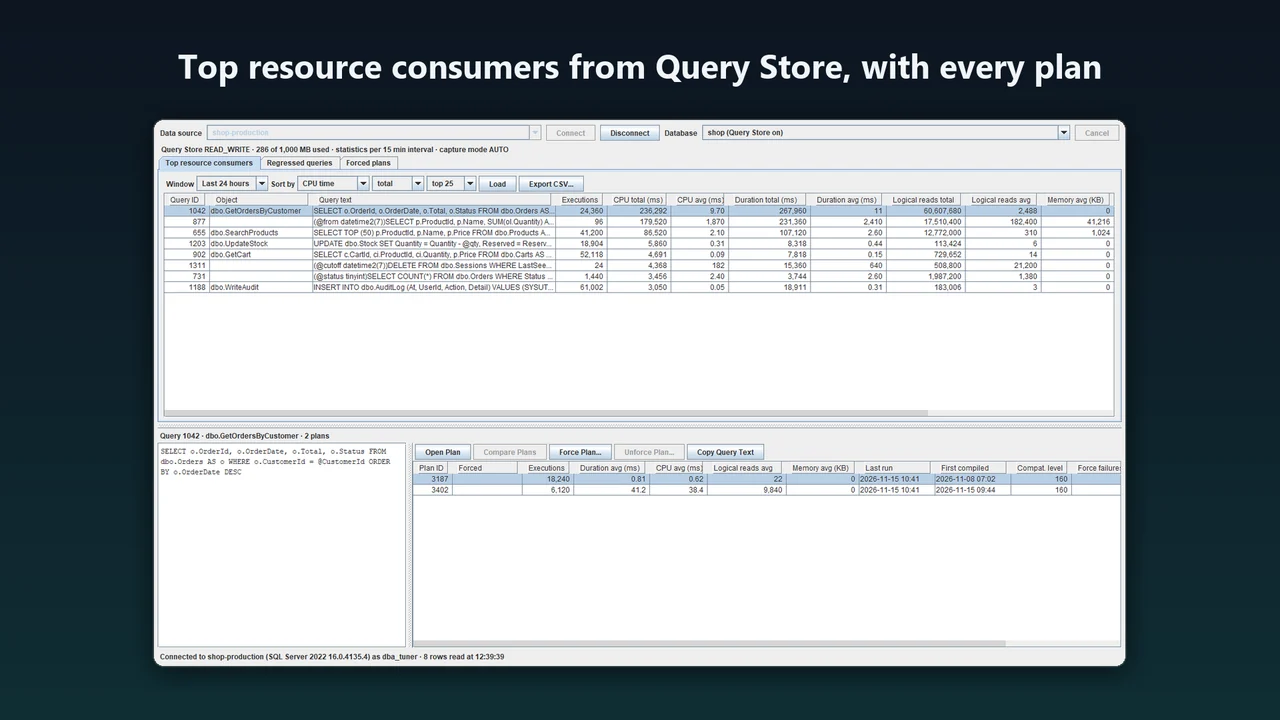
The screenshots in this guide show QueryScope's real Query Store view with a scripted sample server: a shop database where one procedure got a scan plan after a recompile. They are not captures of a full IDE window, and the queries and figures in them are sample data, not a live server.
Step 4: find regressed queries
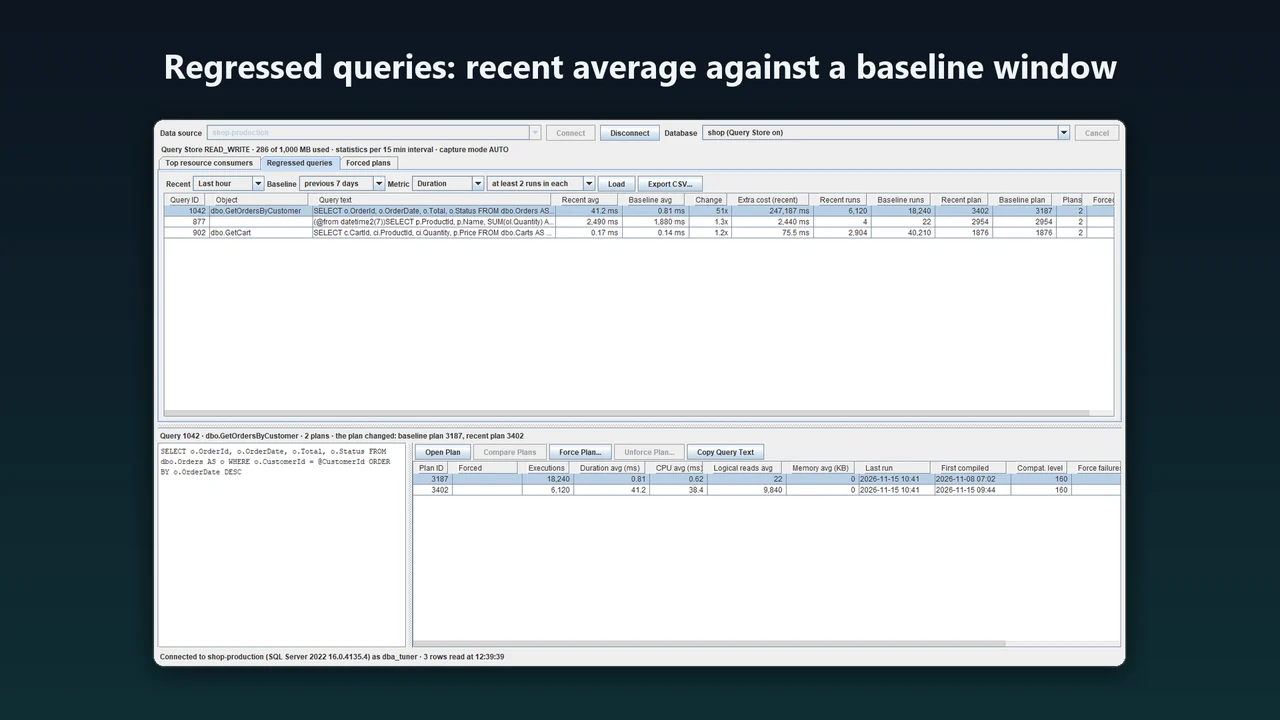
A regression is a query whose recent average is worse than it used to be. Compare two windows that do not overlap: a recent one (for example the last hour) and a baseline before it (for example the 7 days before). Rank by the extra cost, (recent average - baseline average) x recent executions, so that a query that got 20 % slower but runs 50,000 times an hour comes before one that got ten times slower but ran twice.
In QueryScope, the Regressed queries tab shows both averages, how many times worse, the extra cost, the runs in each window and the plan each window ran most. When the baseline plan and the recent plan differ, the plan changed.
Step 5: read the plans
Select a query in QueryScope to see its full text and every plan Query Store holds for it, with the runs, average duration, CPU and reads of each plan in the window. Open Plan shows a plan graphically; Compare Plans shows two plans side by side, with the operators that changed. Query Store stores plans as nvarchar(max), not xml, so very deep plans can be read even where a cast to xml would fail.
A typical cause of a sudden plan change is parameter sensitivity: a procedure compiled for a parameter value that returns many rows gets a scan, and every later call with a selective value pays for the scan too. A recompile (a statistics update, a restart, a schema change) for the other kind of value flips it back and forth.
Step 6: force a plan, and know what it means
When the old plan was clearly better, you can tell SQL Server to use it:
EXEC sys.sp_query_store_force_plan @query_id = 42, @plan_id = 7;
-- and to undo it:
EXEC sys.sp_query_store_unforce_plan @query_id = 42, @plan_id = 7;- The plan stays forced until you unforce it, also after a restart.
- If the plan cannot be used any more (an index it needs was dropped, for example), SQL Server compiles a new plan and counts a force failure: watch
force_failure_countandlast_force_failure_reason_descinsys.query_store_plan. - SQL Server can record the runs of a forced plan under a new plan id with the same shape. That is normal; the shape is what was forced.
- Forcing treats the symptom. Fix the cause when you can: an index that serves both kinds of values,
OPTION (RECOMPILE)for a query that runs rarely, orOPTIMIZE FORa typical value.
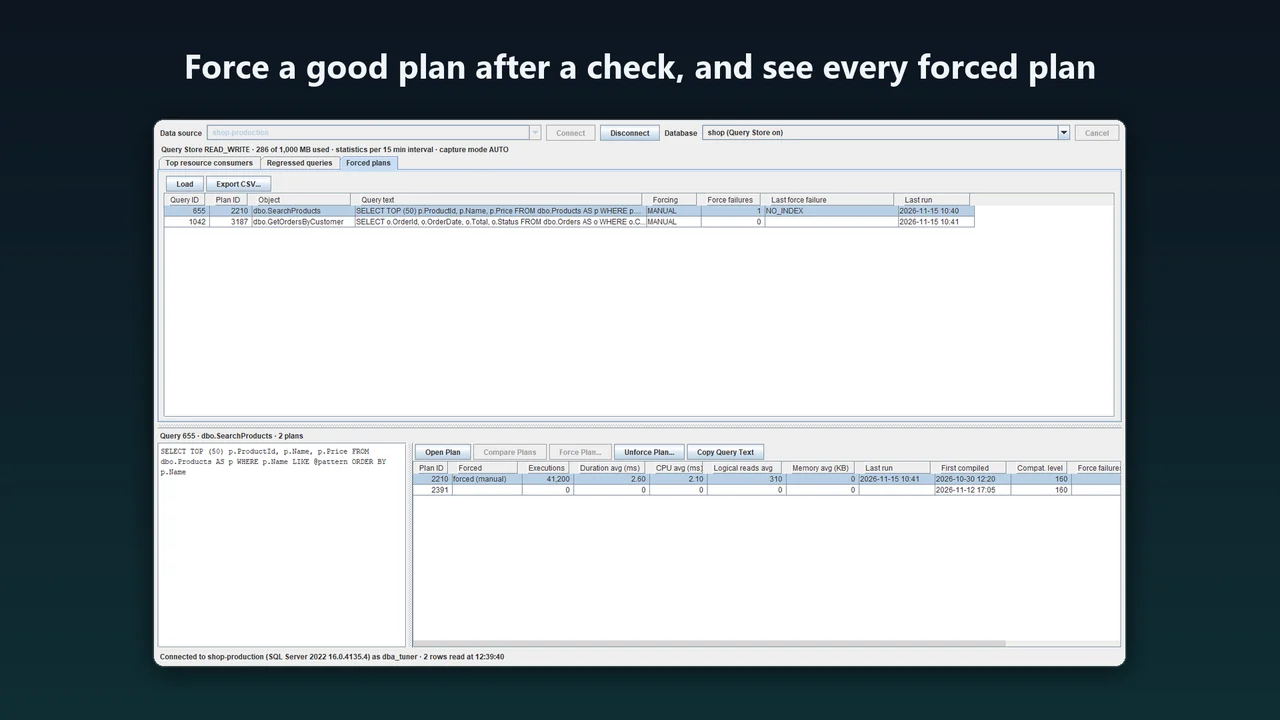
In QueryScope, select the plan and click Force Plan.... The confirmation names the plan, the query, the plan's figures in the window and the plan it replaces. Unforce Plan... undoes it, and the Forced plans tab lists every forced plan of the database with its force failures.
Get QueryScope
The Query Store view is part of QueryScope, next to its Extended Events capture (see how to profile SQL Server queries in a JetBrains IDE), its blocking monitor and its execution plan viewer. It works in DataGrip, IntelliJ IDEA Ultimate and other IDEs with Database Tools, builds 251 to 263. QueryScope costs $39 a year for individuals and $79 for organizations, with a 30-day trial: QueryScope on JetBrains Marketplace.
FAQ
Does QueryScope change my database?
No. Every statement of the Query Store view only reads, except Force Plan and Unforce Plan, which run only after you confirm them and are offered only to a login with ALTER on the database. It never turns Query Store on or changes its settings.
Does it poll the server?
No. It reads Query Store when you choose a database, a tab or a sort order, or click Load. When the tool window is hidden it closes its connection.
Does it store my password?
No. It uses the data source and connection of the IDE.
Does it work on macOS and Linux?
QueryScope runs inside the JetBrains IDE, which runs on Windows, macOS and Linux. Our tests ran on Windows.
Which servers does the Query Store view support?
SQL Server 2016 and later. It is tested on SQL Server 2019, 2022 and 2025. Azure SQL Database is not supported by this version of the view.
What does the Query Store view cost?
It is part of QueryScope: $39 a year for individuals and $79 for organizations, with a 30-day trial on JetBrains Marketplace.
More guides
How to profile SQL Server queries in DataGrip, Rider or IntelliJ with Extended Events
Extended Events replaces SQL Server Profiler. Create a session for rpc_completed and sql_batch_completed, read the ring buffer, and drop the session when you are done, or let QueryScope do it inside your JetBrains IDE.
Read the guide →Find and fix SQL Server blocking in DataGrip
Most of the time SQL Server is not slow: one session holds locks that others wait for. How to find that head blocker from DataGrip, decide what to do with it, read the deadlocks SQL Server already recorded and stop it from coming back.
Read the guide →Copy many tables between SQL Server databases in DataGrip
A handful of tables is a chore; forty tables with foreign keys, identity columns and rows that already exist on the other side is where it goes wrong. The questions to answer first, the manual T-SQL way, DataGrip's own data transfer and a sync script you review first.
Read the guide →